In some articles, slide-shows or review, we need create a chart (diagram, graphs) to convey a message to your readers effectively. Whatever type of data presentation you prefer (pie charts, bubble charts, bar graphs, network diagrams etc.), you can create charts in graphic editors manually or use special desktop-software instead or online services.
Naturally, a document presented beautiful always attractive readers, helping them more engaged in your post. There is a variety of conventional ways to visualize data – tables, histograms, pie charts and bar graphs are being used every day can be beautiful, elegant and descriptive, in every project and on every possible occasion.
However, once you’d like to update an old chart, or create a new one, you have to run the application and create new images over and over again. Or maybe you just want to offer your visitors not a simple image, but a powerful dynamic chart.
That’s not flexible.
Why do not you try using the service-based web, it can use in anywhere with connection to the internet. Sometimes you can find these services are higher quality software.
FusionCharts Free
FusionCharts Free is a Flash charting component that can be used to render data-driven & animated charts for web applications and presentations. It is a cross-browser and cross-platform solution that can be used with ASP.NET, ASP, PHP, JSP, ColdFusion, Ruby on Rails, simple HTML pages or PowerPoint Presentations to deliver interactive and powerful flash charts.
Gliffy

Gliffy.com is a free web-based diagram editor. It enables you to create and share flowcharts, network diagrams, floorplans, user interface designs and other drawings online. Registration is required.
With Gliffy online diagram software, you can easily create professional-looking flowcharts, diagrams, floor plans, technical drawings, and more. Our online diagram editor makes it easier than ever to create great looking drawings.
Gliffy allows you to collaborate with other users by sharing your flowchart in a public workspace. Brainstorming sessions, marketing demos or just a clear plan on how to implement a hardware or software rollout in a large company become quick and easy — there’s no desktop client to install or site registration to think about.
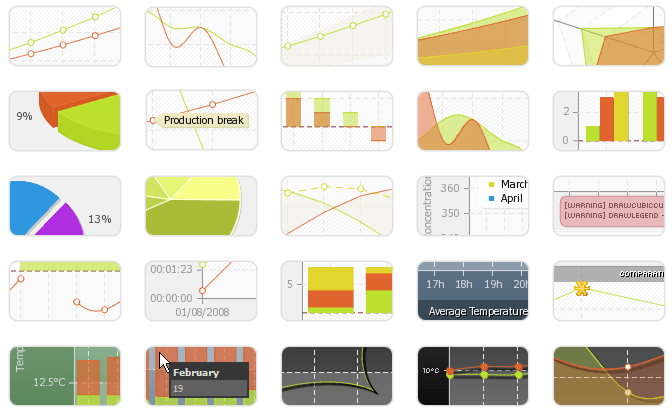
amCharts
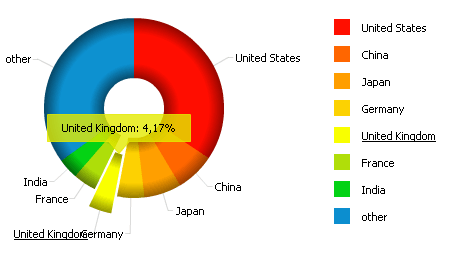
AmCharts is a set of Flash charts for your websites and Web-based products. AmCharts can extract data from simple CSV or XML files, or they can read dynamic data generated with PHP, .NET, Java, Ruby on Rails, Perl, ColdFusion, and many other programming languages.
amCharts offers a flexible and easily customizable solution for generating charts “on the fly”. There are 4 sets with predefined Pie & Donut, Line & Area, Column & Bar and Scatter & Bubble. Generated Flash-files are dynamic and can be presented in 2D or 3D. Some flash-charts also have animation effects.
amCharts is linkware which means that you have to place a link to the source if you’d like to use it for free. You can also purchase a single site license for 85 Euros (~$117). We’ve already reviewed amCharts.
amMap
The beginning of amCharts and amMap was in 2004, when the first version of amMap was made.
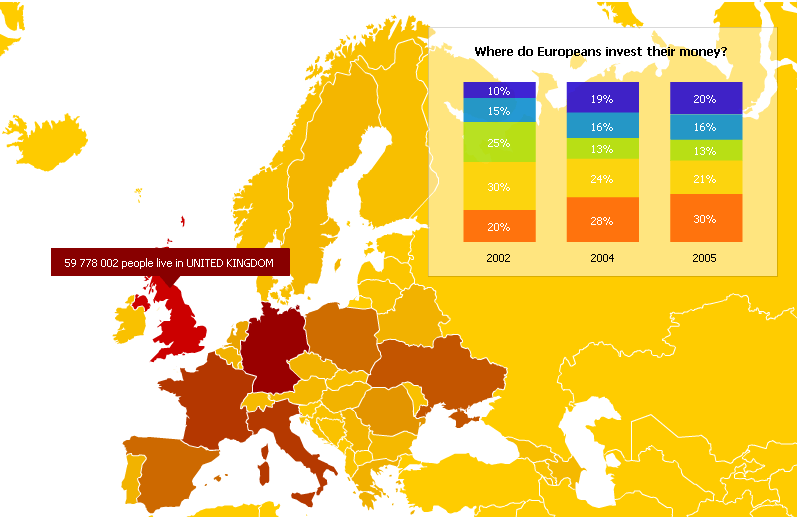
AmMap is a tool for creating interactive Flash maps. You can use this tool to show locations of your offices, routes of your journeys, create your distributor map, etc. Photos or illustrations can be used as layers and backgrounds of maps, so you can make different presentations, e-learning tools and more.
With amMap, you can:
- customize every detail of your map – sizes, colors, disable features you don’t need;
- create multi-level structures;
- create map charts (heatmaps);
- load icons or other custom movies or photos on top of your map;
- use your own custom map textures;
- draw lines and add text;
- set the start-up zoom level and position;
- use it as zoomifyer to display big pictures;
- control the map with JavaScript (reload data and settings, set and get data and separate parameters, register clicks);
- export the map as an image.
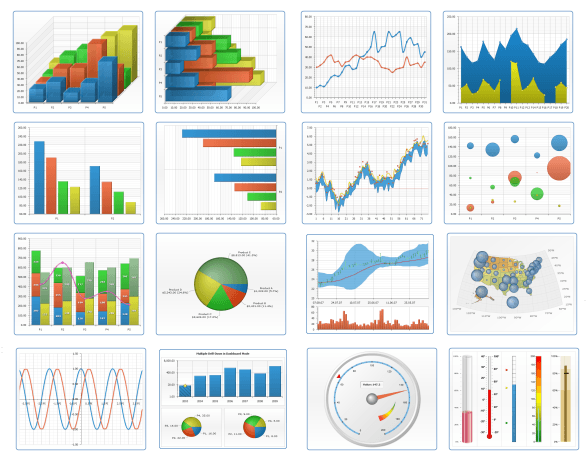
AnyChart
AnyChart is a flexible Adobe Flash based solution that allows you to create interactive and great looking flash charts and dashboards. It is a cross-browser and cross-platform charting solution intended for everybody who deals with creation of dashboard, reporting, analytics, statistical, financial or any other data visualization solutions.
Attractive data visualization is an essential part of any service or application. Ubiquity and performance of Flash technology makes it, probably, the best solution for charting needs.
From individuals to Fortune 500 companies, we treat our customers with respect and give them all our attention and support. Many well known companies, government organizations, and educational institutions have selected AnyChart for their business needs. Here is a list of some names you may recognize: Oracle, Lockheed Martin, Halliburton, NXP Semiconductors, 3M and Rolex. AnyChart is an advanced Flash based data-visualization solution, allowing everyone to utilize power of animation and ultimate interactivity.
Rich Chart Server for .NET
Rich Chart Server generates captivating dynamic Flash charts from ASP.NET and Windows Forms applications. Use the included authoring tool to visually design a rich chart template which can include stunning animation effects, audio narration, text and image elements, links and tooltips, and any other type of visual customization. Apply the chart template to any available .NET data source or XML document to generate an interactive Flash chart with drill-downs, enabling sophisticated data navigation between multiple charts.
Rich Chart Server uses flexible templates to integrate dynamic content from a variety of data sources:
Rich Chart Server can generate impressive charts from the included professionally designed Chart, Axes, Animations and Layout styles, examples:
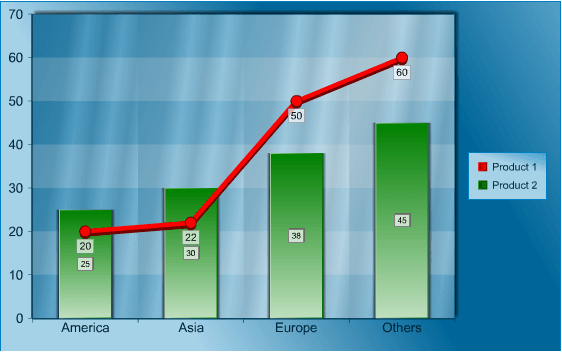
Flash Charts Pro
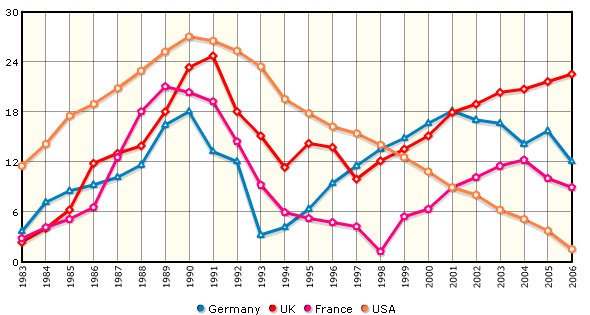
With Flash Charts Pro you can easily install attractive stats on your website and make detailed explanation of all scores that come from different digital sources onto your website or application, presenting it as animated diagrams. All you need to do is upload the core SWF files to the server/include them to your project and configure them via XML data files or you can streamline your data directly to Flash Charts Pro using your favorite scripting language. Flash Charts Pro is easy in use; you do not need to be an advanced programmer for using chart library. It requires no server-based software, there are 2 ways for making it work:
- You can create a list with all your data and Flash Charts Pro will catch it and display in graphics;
- The other way is that you can assign variables and stream all your data into the Flash Charts Pro, so that if data constantly changing all reflections you’ll see on your chart.
Swiff Chart Generator
Swiff Chart Generator is the server-side solution to dynamically serve eye-catching animated charts from ASP.NET forms, PHP scripts or JSP scripts. Query data from a database, apply your own style template created with the Swiff Chart authoring tool and instantly generates high-impact charts in Adobe Flash format, PNG/JPG format, SVG format and PDF format.
Swiff Chart Generator runs in Microsoft IIS and Apache Web Server for both Windows and UNIX platforms. Swiff Chart Generator works with ASP.NET (C# and Visual Basic), ASP, PHP and JSP, giving you the possibility to access any data source and generate dynamic charts for your web site applications.
Open Flash Chart
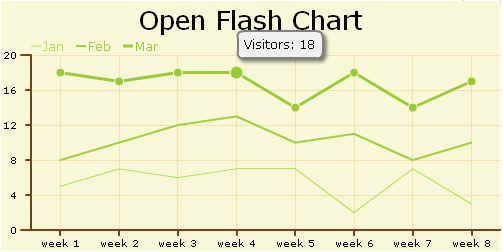
Open Flash Chart is a collection of Flash applets that you embed in your web page, and which fetch data from the web server to display. In both cases you get nice little refinements as well as animated pie charts, and with a little fiddling you can customise the way your graph appears by changing its colours, fonts and size. And Open Flash Chart is British, so you’re not only encouraging open source but British open source.
pChart
pChart is a PHP class oriented framework designed to create aliased charts. Most of todays chart libraries have a cost, our project is intended to be free. Data can be retrieved from SQL queries, CSV files, or manually provided. This project is still under development and new features or fix are made every week.
The pChart charting library is providing many ways to reprensent a single or multiple series of data. We’ll try to add screenshots everytime an interesting functionnality is added to the pChart library.
Origramy
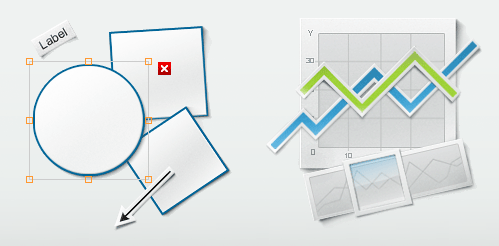
Flash graph editor/viewer component. It can be used to create complex graphs presentations, save them and use the same component as graph viewer.
ComponentArt
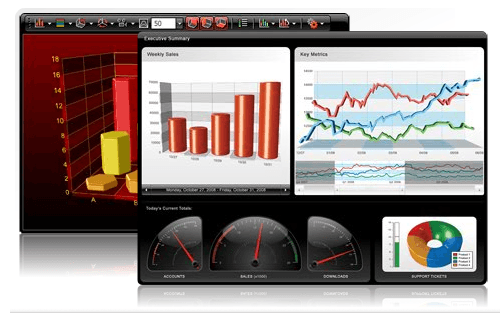
ComponentArt Charting blows away the competition in terms of overall features, rendering output and ease of use. On top of a great product, the support staff is responsive, knowledgeable and helpful in all areas. This product allowed us to design, develop and deploy a solution that is more usable, manageable and extendable than we thought was possible in zero-footprint chart.
Dundas Chart for .NET
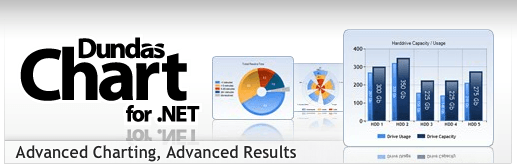
This award-winning component offers the most comprehensive features in the industry, the most complete sample framework, and the best live technical support available. From start to finish, our dedicated team will provide you with the technology you need to make your project successful.
Whether you are implementing charting into internal projects – or building data visualization applications for clients – Dundas Chart offers sophisticated visualization technology to get the most out of your data.
XML/SWF Charts
PHP/SWF Charts offers a simple and dynamic solution for interactive Flash-based charts. Columns, circles, bars and pies can be displayed in 3D. You create an XML source to describe a chart, then pass it to this tool’s flash file to generate the chart. The XML source can be prepared manually, or generated dynamically using any scripting language (PHP, ASP, CFML, Perl, etc.).
The script requires only PHP 4 support; it is free, however all charts are by default linked to the source — unless you’ve purchased a license.
JS Charts
JS Charts is a JavaScript chart generator that requires little or no coding. JS Charts allows you to easily create charts in different templates like bar charts, pie charts or simple line graphs.
The Commercial License cost 149$ allow you get everything inside the JS Charts free pack plus full support for 1 year.
The commercial license allows you to use this JavaScript charts generator legally on the websites that you own or develop under legal partnership with the owner.


Great List… I’d like to suggest you include Creately.com – Online Diagramming. Its in private beta but sign-up and we’ll send you an login.
Hello Charan, I’ve registed a account with mrnarga[at]hotmail[dot]com, waiting for your ticket. 🙂
Thanks Narga, I’ve sent you an invite… hope you like Creately. 🙂
Let me know if you need any help or have any questions.
Cheers
Hi, I have already seen it somethere…
Thank you
Rufor
Super post, Need to mark it on Digg
Thanks
Saurooon
Thanks a lot. I first started with Open Flash chart, but then switched to FlyCharts.
Good list here. Definitely a few I hadn’t seen before. Another one for making flowcharts and diagrams is http://www.lucidchart.com which is also free.
I agree with your list. But I think you could include flashcharts.net
Graphs Made Easy (at http://www.graphsmadeeasy.com) is free, makes great looking graphs by importing data from Excel style programs, or using GME’s own simplified data entry, and has some solutions that may be unique, like multi-coloured line graph lines. (Note: I work for GME)